The Growth of Data
We are living in an age of rapidly growing data. Best estimates suggest 2.5 terabytes of data are being produced every day (IBM Statistics), with the amount of data created doubling every two years, with no signs of slowing anytime soon. Ignoring this data may have been possible in the past, however with Big Data allowing customers and clients easy access to price and quality comparison from millions of businesses, can you really afford to keep ignoring it?
What is Big Data?
Big Data is an evolving term used to describe the huge amount of structured, semi structured and unstructured data that traditional data processing software does not have the power to process.
Big Data tends to be categorised by the ‘four Vs’:
- Volume (the vast amount of data)
- Variety (the many different types of data)
- Velocity (the speed at which data is absorbed)
- Veracity (the uncertainty and legitimacy of data)
The Data Solution
Microsoft’s Power BI is a desktop application that gives you the tools to create interactive data visualisations.
Power BI’s analytic capabilities provide real time, interactive visuals which convey complex data in easy to understand, personalised graphics, giving you the ability to enhance decision making within your business.
As the visuals are simple, anyone will be able to understand them, meaning it’s great for people who aren’t comfortable with statistics as well as people who don’t have time to decipher what your data means.
Power BI offers a huge variety in charts, graphs and visuals for how your data can be displayed. From basic line graphs and bar charts, to data layered maps and even custom visuals, Power BI will have the answer to your data analytics needs. The full list can be found here.
Finally, Power BI data can be stored both within the cloud and on your desktop. This gives you the opportunity to store all your data locally, or be able to access it from anywhere, anytime; Power BI even has a specific mode for mobiles and tablets.
Why Power BI?
Power BI is a simple, effective solution that will improve your decision making efficiency. With the correct treatment from Objective IT, we can help you:
- Understand the key drivers and correlations behind your KPIs
- Diagnose which areas of your business are struggling and need adapting
- Utilise predictions to better mitigate risk
- Identify which of your customers are most beneficial to your business
- Drive innovation
Power BI Use Case
The Problem:
Before they came to us, this client had monthly meetings with the board in which they had to prepare reports of all their data. This was being done with excel spreadsheets, by which many would be printed out and handed around the meeting. The board members would then ask the ‘what if’ questions, to which the client just couldn’t answer with simple excel spreadsheets, often leaving questions unanswered.
The Solution:
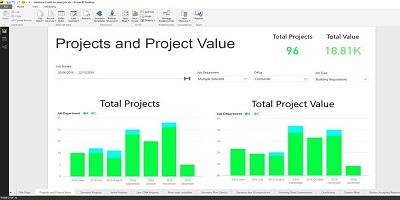
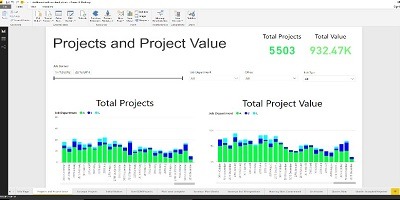
Objective IT was able to integrate the client’s database with Power BI, alongside designing bespoke dashboards according to the client’s needs. This allowed the client to no longer spend hours prepping for monthly meetings, as all the dashboards and data are available instantaneously. It also allowed for the client to go into meetings with live data, as well as being able to now answer the ‘what if’ questions, as the dashboards are fully interactive with slicers, allowing the client to show what data they wanted to within the dashboard being viewed.
Business Benefits:
Reduced Preparation – No longer does the client need to spend hours prepping for a meeting
Instantaneous Data – Data accessed is live from your database, so you can see exactly what is happening in real time
Easily Understandable – Attractive, simple visuals allow even the least tech savvy colleagues to understand what the data is portraying
Products and Technologies Used:
Microsoft Power BI, Microsoft SQL server
Contact us
To find out more, check out our web page on Business Intelligence
To utilise the ‘power’ of Power BI – with the help of our data consultants please get in touch